Sales Increased While Regional Pricing Remained Relatively Stable
The Austin–Round Rock–San Marcos market recorded more completed and pending sales than one year earlier, while the median sales price moved only modestly.
The headline: Unlock MLS reported 2,739 residential sales across the Austin–Round Rock–San Marcos MSA in July 2026, a 4.4% increase from July 2025. The regional median sales price was $435,000, up 1.0% year over year.
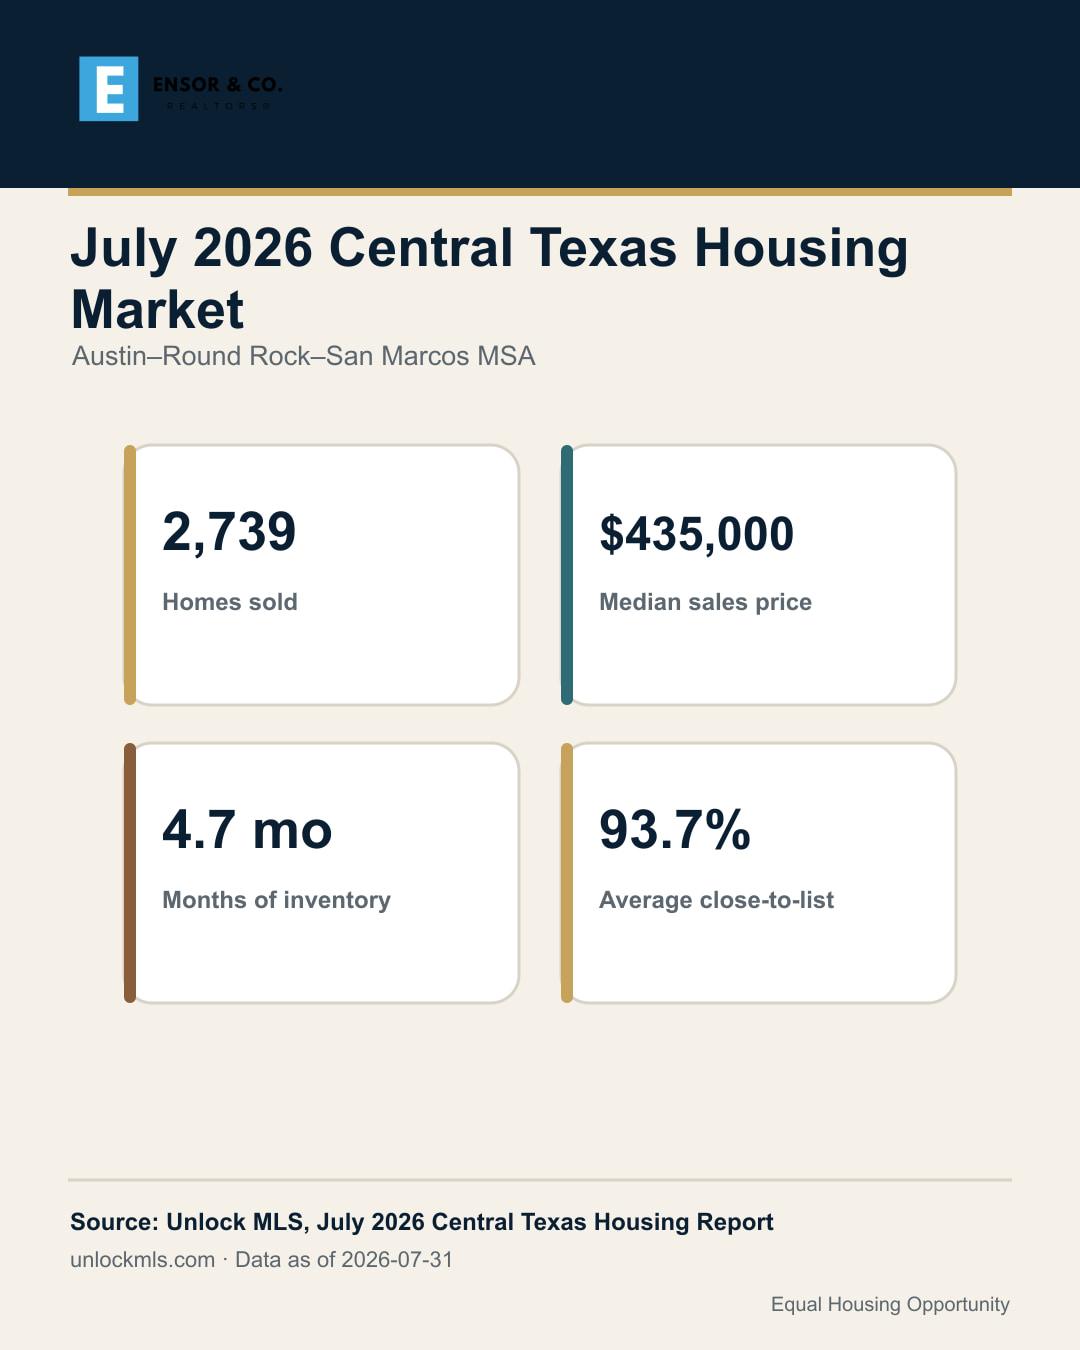
What changed across the regional market?
| Measure | July 2026 | Change from July 2025 | Practical context |
|---|---|---|---|
| Residential sales | 2,739 | +4.4% | More transactions closed than one year earlier. |
| Median sales price | $435,000 | +1.0% | Regional pricing changed modestly. |
| Pending sales | 2,833 | +4.1% | Contract activity also exceeded July 2025. |
| Active listings | 13,796 | −9.9% | Buyers had fewer active choices regionwide. |
| Months of inventory | 4.7 | −1.1 months | Supply tightened compared with one year earlier. |
| Average close-to-list ratio | 93.7% | 93.0% in July 2025 | Pricing and negotiation remained important. |
Local results were not uniform
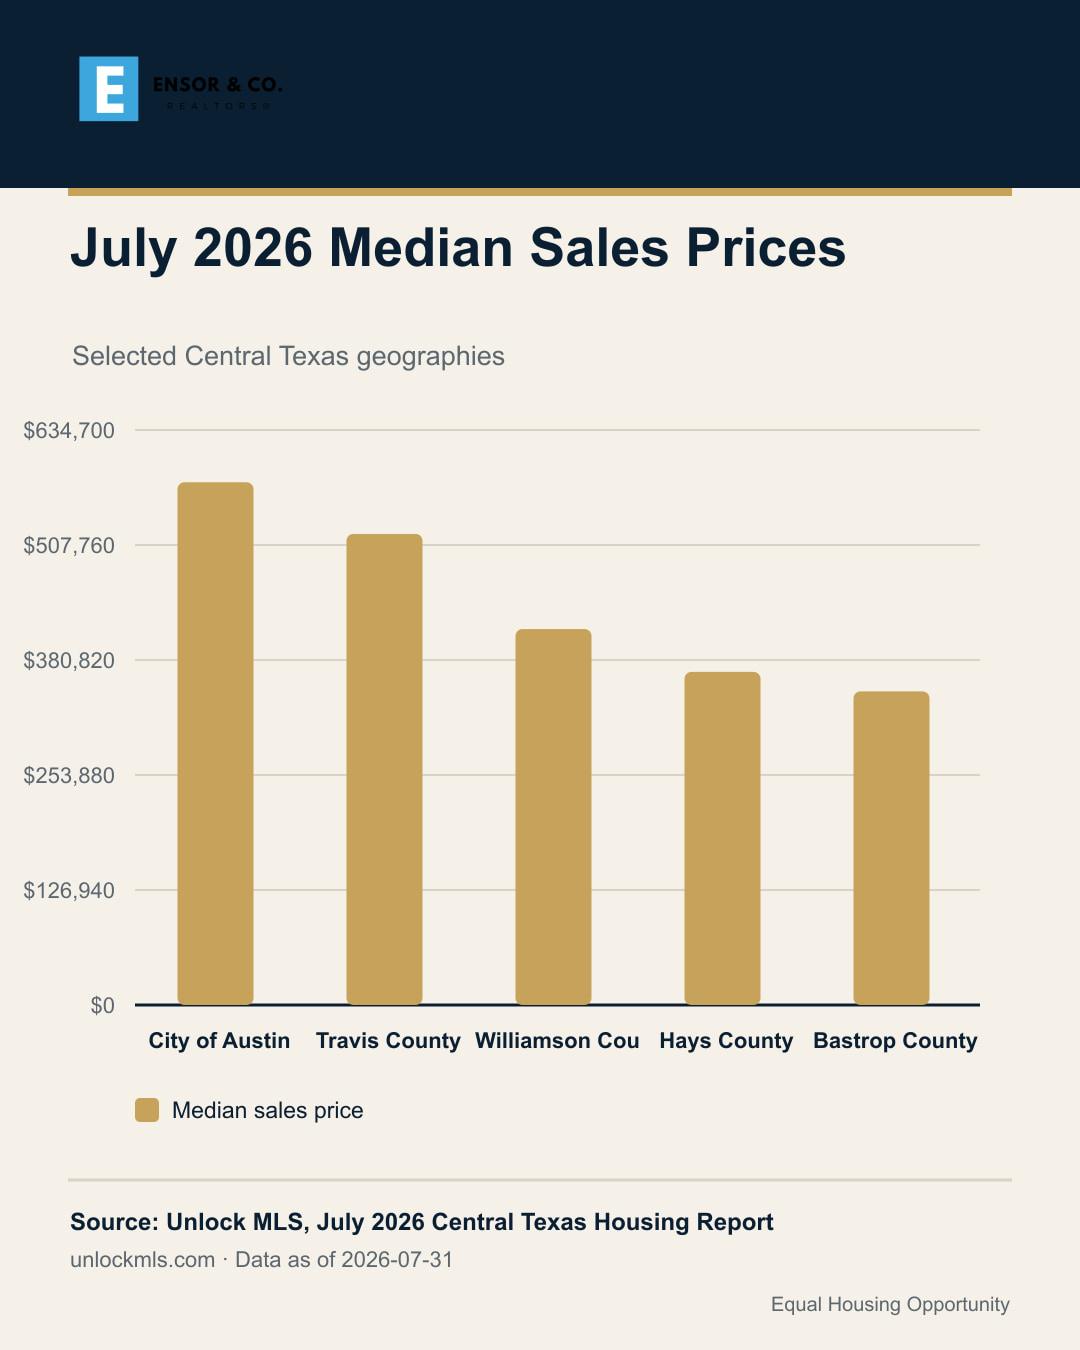
Regional data is useful, but county and city results show why a property-specific analysis still matters. July median sales prices ranged from $577,000 in the City of Austin to $346,140 in Bastrop County among the selected areas below.
| Geography | Sales | Sales change | Median price | Price change | Inventory |
|---|---|---|---|---|---|
| City of Austin | 1,005 | +11.0% | $577,000 | −1.4% | 4.5 months |
| Travis County | 1,290 | +11.4% | $520,000 | −0.3% | 4.8 months |
| Williamson County | 957 | +6.0% | $415,000 | −1.2% | 4.3 months |
| Hays County | 344 | −12.0% | $367,700 | +1.0% | 5.0 months |
| Bastrop County | 110 | −16.0% | $346,140 | +2.3% | 6.3 months |
What the July report means for real-estate decisions
For sellers
Buyer activity improved from July 2025, but the 93.7% average close-to-list ratio shows that sellers should not assume every property will command its asking price. Positioning, condition, presentation and neighborhood-level comparable sales remain central to the result.
For buyers
The region had fewer active listings than one year earlier, yet the median price increased only 1.0%. Competition may be stronger for selected properties while negotiating opportunities remain elsewhere.
For landlords and investors
The regional median lease price was $2,195, down 0.2%, while closed leases declined 6.5%. Evaluate rent history, vacancy, operating costs and nearby rental competition at the property level rather than treating the regional figures as a forecast. Owners preparing to market a rental can review our lease listing and tenant placement services.
Lease-market snapshot
| Measure | July 2026 | Change from July 2025 |
|---|---|---|
| Closed leases | 3,230 | −6.5% |
| Median rent | $2,195 | −0.2% |
| Active lease listings | 4,342 | −26.2% |
| Pending leases | 3,476 | +3.5% |
| Months of lease inventory | 1.7 | −0.3 months |
Regional data is the starting point. Local analysis completes the picture.
Considering a sale, purchase or investment? Ensor & Co., Realtors can prepare a focused review for your property, neighborhood or search area.
Request a property-specific market reviewGeography: Austin–Round Rock–San Marcos MSA, with selected city and county comparisons. Reporting period: July 1–31, 2026. Comparison basis: July 2025 unless otherwise stated. Source: Unlock MLS July 2026 Central Texas Housing Report , released August 11, 2026. Statistics may be revised by the source. Information is general and is not legal, tax or financial advice.
Request your market review
Tell us which property, neighborhood or search area you would like to evaluate, and an Ensor & Co., Realtors advisor will follow up.