Three Market Signals Central Texas Sellers Should Watch
The latest regional housing figures tell a more nuanced story than
“prices are up” or “prices are down.” For homeowners considering a sale,
the relationship between price, inventory and actual closing results is
where the useful information begins.
For the Austin–Round Rock–San Marcos metropolitan area,
Unlock MLS reports a median sales price of $412,000,
5.1 months of housing inventory, and an average
93.2% close-to-list ratio for August 2026.
Those numbers provide valuable regional context, but they do not tell
us what an individual home should be worth. That distinction matters
considerably for sellers deciding how to position a property in the
current Central Texas market.
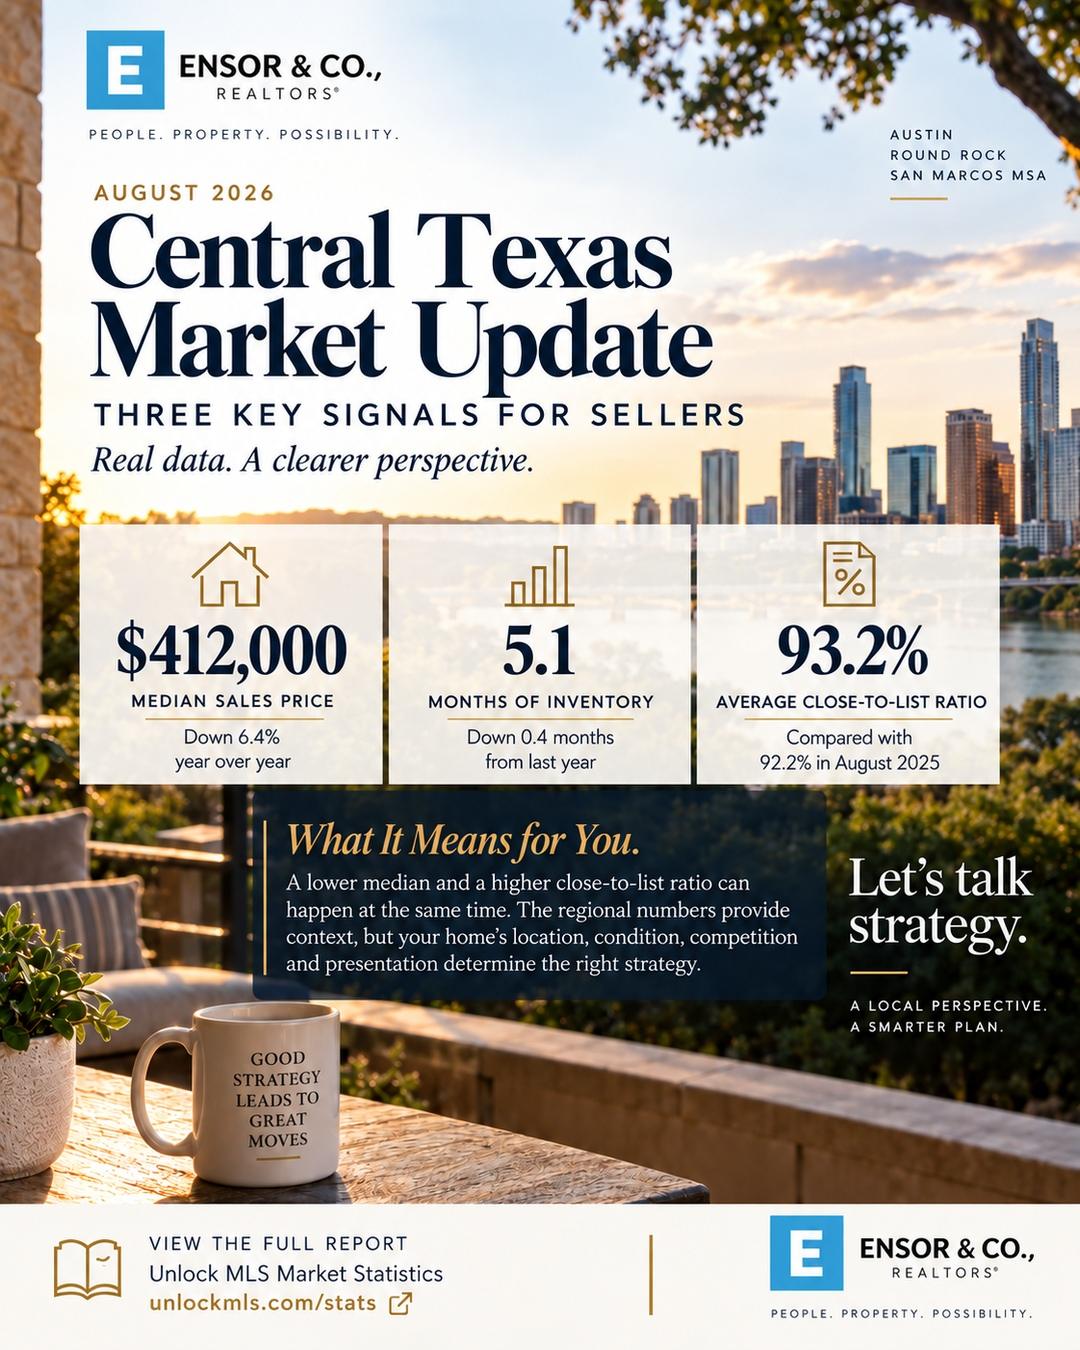
Austin–Round Rock–San Marcos MSA. Source: Unlock MLS.
What the $412,000 median price actually tells us
The regional median sales price was $412,000 in August
2026, according to Unlock MLS, representing a
6.4% year-over-year decline.
For sellers, the important word is regional. A metropolitan
median combines transactions across numerous communities, price
ranges, property types and market segments. It is useful for
understanding the direction of the broader market, but it is not a
substitute for determining the competitive position of a particular
home.
A seller in Lakeway, Steiner Ranch, Leander, Round Rock or another
Central Texas submarket should ultimately be looking much more closely
at the homes competing for the same buyer—not simply the MSA-wide
median.
Inventory is part of the pricing conversation
Unlock MLS reported 5.1 months of inventory across
the Austin–Round Rock–San Marcos market in August, down 0.4 months
from the comparable period a year earlier.
Inventory matters because sellers are not pricing in isolation. Buyers
compare a home against the alternatives available to them at roughly
the same time and price point.
That makes the property’s immediate competitive set especially
important. Two homes in the same metropolitan market can face very
different selling environments depending on neighborhood inventory,
condition, price range, property characteristics and the alternatives
currently available to buyers.
The 93.2% close-to-list ratio deserves attention
The average close-to-list ratio reached 93.2% in
August 2026, compared with 92.2% in August 2025.
This metric compares final sales prices with asking prices across the
reported transactions. Its improvement does not mean that every seller
received 93.2% of an original asking price, nor does it establish what
a particular property will sell for.
It does, however, provide another useful piece of context. A declining
regional median can coexist with an improving close-to-list ratio
because the two statistics answer different questions.
For a seller, the practical takeaway is that broad market direction
and the execution of an individual listing strategy should be analyzed
separately.
What should a Central Texas seller evaluate before listing?
Regional statistics are the starting point. A property-specific
strategy should go considerably deeper.
Active inventory helps establish the choices a buyer will see alongside your home.
Relevant closed sales help establish what buyers have recently been willing to pay.
Market-to-contract timing can reveal important differences between pricing strategies.
Buyers may weigh updates, maintenance, presentation and anticipated ownership costs differently from one property to another.
Pricing, presentation, photography, distribution and the property’s first exposure to the market should work together rather than as separate decisions.
Why the first-market impression matters
Today’s buyers can compare substantial amounts of inventory quickly.
That makes the initial positioning of a listing particularly important.
At Ensor & Co., we believe a pricing recommendation should be
supported by the property’s relevant sales, current competition and
individual characteristics—not simply a broad regional statistic or
an automated estimate.
The August report establishes the backdrop. The next step for an
individual seller is determining where their home fits within that
backdrop.
Considering a Sale in Central Texas?
We can prepare a property-specific market and pricing analysis that
looks beyond regional averages to the sales, competition and market
conditions most relevant to your home.
Central Texas Market Update FAQ
What was the median home sales price in the Austin area in August 2026?
Unlock MLS reported a $412,000 median sales price for the
Austin–Round Rock–San Marcos MSA in August 2026, down 6.4% from the
comparable period a year earlier.
How much housing inventory did Central Texas have in August 2026?
Unlock MLS reported 5.1 months of inventory for the
Austin–Round Rock–San Marcos market in August 2026, down 0.4 months
year over year.
What does a 93.2% close-to-list ratio mean?
The reported ratio compares sales prices with asking prices across
the transactions included in the market data. It is a regional
measure and should not be interpreted as a prediction of an
individual home’s sale price.
Can regional market statistics determine what my home is worth?
No. Regional statistics provide useful market context, but an
individual property should be evaluated using relevant sales,
current competing inventory, location, condition, property
characteristics and other property-specific considerations.
Request a Market Review